Companion to Chapter 2. Chapter 2 teaches the six-field cognitive minimum — the discipline of writing a one-page BRD (audience, decision, question, comparison, time window, success criterion) before opening Power BI. This page carries what the book cannot: curated further reading beyond Appendix C, a five-question self-check quiz, and a hands-on activity that walks the discipline end-to-end against the CloudRevenue starter BRD.
Use the further reading to widen the discipline; use the quiz to check whether the chapter's key concepts have moved into reflex; use the activity to feel where the discipline gets uncomfortable. The discomfort is the data.
Further reading
Books, articles, and videos beyond the book's own bibliography (Appendix C, updated in errata). These extend the BRD-context discipline into adjacent domains — product management, stakeholder interviews, decision intelligence — where the same "get the question right before the answer" pattern shows up under different names.
- Cassie Kozyrkov — Decision Intelligence writing. Kozyrkov (former Google Chief Decision Scientist) has a long-running series on framing decisions before analysis begins. The decision question in her framework and the decision field in the BRD are the same instrument. Start with any of her posts on Medium at kozyrkov.medium.com.
- Colin Bryar & Bill Carr — Working Backwards (2021). The Amazon PR-FAQ discipline: write the press release and the customer FAQ before the product exists. Same shape as the six-field BRD (name the audience and the outcome before authoring the artifact). The book's Ch 4 is the operative one for BRD-adjacent readers.
- Amy J. Ko — Design Methods, chapter on requirements. Free online textbook from the University of Washington covering user research and requirements elicitation with academic rigor. The transcript-driven elicitation loop in Appendix E is the practitioner form of what Ko formalises. Available at faculty.washington.edu/ajko/books/design-methods/.
- Nielsen Norman Group — Stakeholder Interviews. A large body of practitioner writing on how to run the conversation the BRD is meant to force. Start at nngroup.com/articles/ and search for stakeholder interview. Their articles read as short and operational, closer to a checklist than a treatise.
- Julie Zhuo — The Making of a Manager (2019) and The Looking Glass newsletter. Zhuo (former Facebook VP of Design) writes with unusual clarity about the stakeholder-alignment conversations analysts and PMs have to lead. Useful when the confirming half of the BRD discipline (the harder half) is what you're struggling with. Newsletter at lookingglassletter.com.
Last curated: 2026-07-08. Reviewed quarterly. Suggestions welcome via the errata page.
Self-check quiz
Five questions on the chapter's key discipline points. Answer them out loud before opening the reveal — if you can name the answer without prompting, the concept has moved into reflex. If not, the concept is still in working memory, which is the state where it decays fastest.
-
Q1. Chapter 2 opens with four questions Marcus writes before opening Power BI. Name them.
Show answer
Who is the audience? Name a specific role, not a tier. — What decision will the audience make? Name the action that follows from looking at the chart. — What question must the chart answer to inform that decision? The question the chart's title would be, if you were brave enough to put the question on the chart. — What comparison does the answer require to be meaningful? A number alone is not a story.
-
Q2. Name the six fields of the BRD cognitive minimum.
Show answer
Audience · Decision · Question · Comparison · Time window · Success criterion. The first four are the four questions from the chapter opener, in BRD-format prose. Time window and success criterion turn the questions into a deliverable.
-
Q3. The chapter names five comparison reference frames — the single primary reference frame against which a chart's answer is interpreted. Name them, and match each to one situation where you would pick it.
Show answer
Target — plan attainment, quota, OKR progress. Prior period — growth, trend, momentum. Peer — ranking, relative performance, allocation. Threshold — risk, exception, SLA, alert. Forecast — pacing, on-track-to-land, forward risk. The chapter's load-bearing move: one primary comparison per chart. Two primary comparisons means two charts.
-
Q4. The chapter describes three nested tests a chart must pass depending on the audience it serves. Name them and the audience each fits.
Show answer
Five-second test — charts on a screen mid-meeting, in a deck opened twenty seconds before walkthrough, in a status email scrolled on a phone. Executive glance. Strictest; no room to investigate. Thirty-second test — charts in a working session, a weekly review, a presentation where the audience has time to engage. Three-minute test — analytical artifacts that live in a report, brief, or research deliverable. A chart that passes the strictest test it is meant for almost always passes the easier ones.
-
Q5. A BRD that is authored is not automatically a BRD that works. The chapter names three authoring-side validity checks that separate a BRD from a BRD-shaped artifact. Name them and explain what each catches.
Show answer
Single-sentence check — each field's answer should be one declarative sentence. And is the giveaway that two answers have been packed into one slot (two audiences means two charts). Disagreement check — hand the BRD to the stakeholder. If they cannot find anything to disagree with, the BRD is too vague to commit them to anything. Reversal check — if the chart could be authored to satisfy a BRD with the opposite answer in any field, the field is too loose. Audience finds the chart useful fails; audience names the three defund candidates in under two minutes passes.
Marcus’s compromise dashboard, up close
The dashboard on the left is what Marcus would build if he merged the two BRDs — one for the VP of Cloud Sales Operations (who needs to name three defund candidates for next planning cycle) and one for the regional director for NA-East (who needs to name two products to push this quarter). The merge produces six technically-correct visuals on one page that fail both audiences: neither can find the number they walked in for. The alternative on the right is what two-BRD elicitation produces: one small chart per audience, each answering its audience’s specific decision question in a defined read-time.
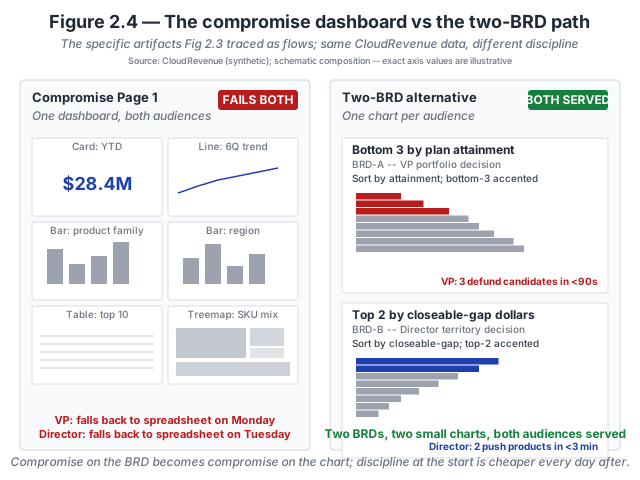
- The compromise page has six visuals; neither audience acts on any of them. Every visual is technically correct: numbers reconcile, chart families are defensible in isolation, colour palette is consistent. The failure is at the BRD level, not the chart-craft level — the merged BRD names two audiences and no decision, and the resulting page is the reasonable-effort output for that spec.
- The VP’s chart uses plan-attainment as the sort key, not revenue. Ranking products by absolute revenue would put the largest lines at the top — the ones the VP is least likely to defund. Plan-attainment ascending puts the defund candidates in the eye’s first landing zone. The bottom three are accented because the decision is about three.
- The director’s chart uses closeable-gap dollars, not conversion rate. Conversion rate is a percentage that hides the size of the opportunity; closeable-gap dollars is what earns the director’s attention in the Q4 pipeline meeting. Top two are accented because the decision is about two.
- Read-time is a specified budget, not an emergent property. Ninety seconds for the VP (a portfolio decision that needs care); one-hundred-fifty seconds for the director (an operational decision that reads faster because the audience already knows the region). The budget is written into the BRD and defended in the chart shape.
Why the two-BRD path is cheaper. The compromise page takes longer to build (six visuals) and longer to maintain (six spots where a data-model change breaks something) than the two-BRD alternative (two visuals, one per audience). The apparent savings from «one artifact for two audiences» disappear the moment either audience opens their own spreadsheet to reproduce the decision the dashboard should have delivered. Chapter 2 walks the math in The BRD as the contract between the analyst and the audience.
Inspect the structure. The compromise-page visual inventory and the two-BRD solution structure are available as a flat CSV so you can reproduce either the six-visual failure or the two-visual solution in your own tool. Download marcus-compromise.csv · Dataset README and schema.
Try this activity — complete the CloudRevenue starter
This activity walks the full BRD discipline against a real starter artifact. Total time: 45–60 minutes for the first pass; 25–30 minutes once the discipline is familiar.
-
Download the starter in Word format. Grab cloudrevenue-starter.docx from Appendix E. Sections 1–3 (Executive Summary, Business Context, Key Business Questions) are filled in; Sections 4–8 are intentionally underspecified. That is your exercise surface.
-
Skim the dataset schema. Open SCHEMA.md for the CloudRevenue dataset. Note the three known imperfections (NA-region naming inconsistency, ~30% nulls in the last two months of revenue, twelve mid-window churners). At least one will show up in Section 6 (Data Requirements) when you get there.
-
Author Sections 4–8 in the Word document. Work in order. As you write, run the three validity checks from Chapter 2 against each field:
- Single-sentence check: if a field needs and, split it into two fields or into two BRDs.
- Disagreement check: imagine handing the field to the VP. Is there anything they could disagree with? If no, the field is too vague.
- Reversal check: could the chart be built to satisfy a BRD with the opposite answer in this field? If yes, the field is too loose.
-
Compare against the completed exemplar. Open cloudrevenue-completed.docx. Read Sections 4–8 side-by-side with your own version. Do not try to match it field for field. The point is to notice where your Section 4 Success Criteria are measurable versus aspirational, where your Section 6 Data Requirements name the known imperfections versus glide past them, and where your Section 8 Constraints acknowledge the offsite deadline versus leave it implicit.
-
Reflect (three prompts). Write one sentence in response to each:
- Which section was hardest to write, and why?
- Where were you tempted to be vague, and what would a stakeholder have pushed back on?
- Which of the three validity checks caught something in your draft you had not noticed?
The reflection is the activity's payoff. Skipping it turns the exercise into paperwork.
Optional extension: run the transcript-driven elicitation loop (Appendix E § Section 2) instead of authoring cold. Compose a short simulated transcript of the VP's kickoff call and use the template-fill prompt to produce a draft BRD, then fill the [PLACEHOLDER] gaps by hand. Compare the loop-generated BRD to your hand-authored one; the differences are what the loop is for.
Related site resources
- Appendix E — BRD Field Guide Resources: the eight-section template, five reference BRDs (AIRS exemplar, CloudRevenue completed exemplar, four starters), and three elicitation prompts. All available in both Markdown and Word.
- CloudRevenue dataset: the synthetic subscription-revenue dataset this chapter's worked example runs against. 8 product families × 247 tenants × 36 months.
- Chart Gallery: once your BRD is authored and you know what comparison the chart needs, the gallery is where you pick the form. Chapter 4 pairs with the gallery directly.
- Prompt Library: the seven canonical prompts from Appendix B. Once your BRD exists, the prompts become the scaffold for directing Copilot in Part II.
Cited in the book
Chapter 2's bibliography lives in the book's Appendix C (living version in errata). The chapter's operative references:
- Kirk, A. (2024). Data Visualisation: A Handbook for Data Driven Design (3rd ed.). SAGE. The canonical framing for context and editorial intent.
- Knaflic, C. N. (2015). Storytelling with Data. Wiley. The reference work for the audience-and-action framing this chapter builds on.