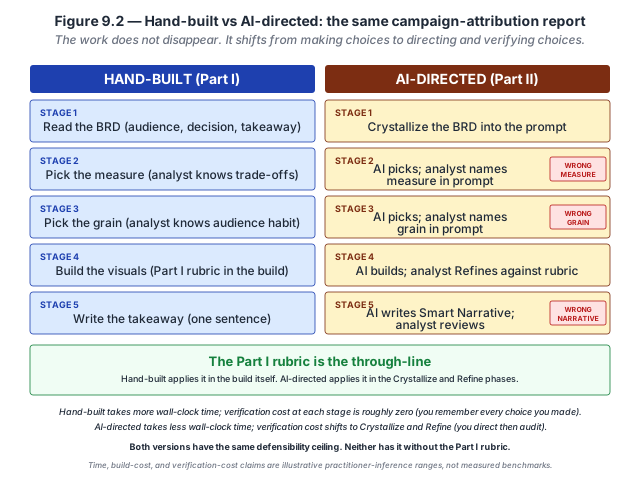
Companion to Chapter 9. Chapter 9 names three specific failure modes Copilot Report Generation produces — wrong-measure (right question, close-but-not-the-BRD measure), wrong-grain (right measure, wrong aggregation level), and wrong-narrative (right chart, wrong Smart-Narrative causal claim) — and prescribes the per-failure verification move for each. It also names the upstream investment that makes the failure modes rarer: a Copilot-ready semantic model (clean field names, documented measures, no overlapping semantics, hidden technical columns, Prep-for-AI configuration). Every shipped report carries the six-piece defensibility bundle. This page carries what the book cannot: curated further reading beyond Appendix C on semantic-model design and Copilot for Power BI, a five-question self-check quiz on the three failure modes, and a hands-on activity that reconciles a Copilot report against source of truth.
Use the further reading to understand the vendor surface (Copilot for Power BI docs) and the semantic-model discipline that makes the surface defensible. Use the quiz to internalize the three-failure-mode taxonomy. Use the activity to feel the difference between a report Copilot said is right and a report the source of truth confirms is right.
Further reading
Docs, books, and community sources beyond the book’s own bibliography (Appendix C, updated in errata) on the semantic-model discipline Copilot Report Generation depends on.
- Microsoft Learn — Copilot in Power BI overview. The vendor documentation catalog for Copilot in Power BI: what it can generate, what surfaces it lives on, and what its documented failure modes look like. Read this side-by-side with Ch 9 because the surface changes; the failure taxonomy is more stable than the button locations. Free at learn.microsoft.com/power-bi/create-reports/copilot-introduction.
- Ferrari, A., & Russo, M. (2019). The Definitive Guide to DAX (2nd ed.). Microsoft Press. The canonical treatment of DAX and semantic-model design. The wrong-measure failure mode Ch 9 names has a specific technical cause: overlapping or ambiguous measures the model author did not disambiguate. Ferrari and Russo teach the discipline that prevents the overlap. Long book; the chapters on measures and evaluation context are the direct pairing.
- SQLBI — DAX Patterns. Community-authored reference of proven DAX patterns for semantic-model measures, maintained by the SQLBI team (Ferrari and Russo). Useful when the Ch 9 activity surfaces a wrong-measure failure and you need to look up the correct pattern for the intended calculation. Free at daxpatterns.com.
- Kimball, R., & Ross, M. (2013). The Data Warehouse Toolkit (3rd ed.). Wiley. The foundational treatment of dimensional modeling — the star-schema discipline the «Copilot-ready semantic model» concept builds on. Copilot performs measurably better on well-conformed dimensional models than on flattened tables; Kimball is the primary source for what «well-conformed» means. Chapters 1–3 for the framework; the rest as reference.
- Microsoft Learn — Prep data for AI. The three-component Prep-for-AI workflow (AI data schemas, verified answers, AI instructions) — the upstream investment that makes Copilot Report Generation and Q&A defensible without heroic per-artifact verification. Ch 11 covers Prep-for-AI in depth; the doc catalog is here. Start at learn.microsoft.com/power-bi/create-reports/copilot-ai-content-prep-overview.
Last curated: 2026-07-18. Reviewed quarterly. Suggestions welcome via the errata page.
Self-check quiz
Five questions on Ch 9’s load-bearing concepts. Answer them out loud before opening the reveal.
-
Q1. Name the three Copilot Report Generation failure modes and give a one-line signature for each.
Show answer
Wrong-measure — Copilot picked a field that is close to but not the one the BRD named (e.g., gross revenue when the CFO always means net revenue). Wrong-grain — Copilot aggregated at a level that hides the trend the audience needs to see (monthly rollups when the audience needs the weekly inflection). Wrong-narrative — the Smart Narrative names a cause or emphasis the analyst would not have written by hand (the paragraph reads correctly but foregrounds a claim the visual does not support). Most expensive of the three: wrong-measure, because the report can look correct in every other respect.
-
Q2. For each of the three failure modes, name the verification move that catches it.
Show answer
Wrong-measure → click Add to page on each visual and reconcile the field set against your BRD-named measure. Wrong-grain → compare the chart’s time or entity grain to the grain the BRD calls for. Wrong-narrative → read the Smart Narrative next to the BRD takeaway, and check whether the narrative’s emphasis matches. All three verifications are cheap when done in sequence; the failure comes from skipping one because the report «looks fine.»
-
Q3. What is a «Copilot-ready semantic model,» and what specifically does making a model Copilot-ready cost the model author?
Show answer
An upstream investment in clean field names, documented measures, no overlapping semantics, hidden technical columns, star schema, and Prep-for-AI configuration. The cost: a few hours of model-author time per model, plus a discipline around not shipping fields with names like Amount1 or Revenue_Test_v3. The payoff: Copilot Report Generation stops producing wrong-measure failures because it no longer has to guess which field the BRD-word means. The investment is per-model (once) rather than per-artifact (every time), which is why Ch 9 calls it the highest-leverage move in Part II.
-
Q4. Ch 9 emphasises that Copilot is nondeterministic. Where is this documented, and what is the implication for verification?
Show answer
Microsoft documents the Copilot model in Power BI as nondeterministic and not guaranteed to produce the same answer for the same prompt, model, and data across sessions. Implication: verification is per-artifact, not per-prompt. A report that passes review on Tuesday is not the same report that would have been produced on Friday from the same prompt. The defensibility bundle captures the specific artifact that shipped, along with the prompt that produced it; the bundle is what makes the artifact traceable even though the model is not reproducible.
-
Q5. The chapter argues Diego’s reconciliation habit (reconcile the Copilot report against a DAX source-of-truth query) is not per-report overhead but per-model insurance. Why?
Show answer
The reconciliation surfaces model defects (bad measures, overlapping semantics) that Copilot inherits from the model. Once the model is fixed, the reconciliation stops surfacing failures for that class. A team that reconciles every report for a quarter effectively hardens the model; after that, only genuinely new specifications require reconciliation as tight as the first pass. The habit compounds — each caught failure improves the model, which reduces the next failure’s likelihood. Not doing it means every future report is at the same failure baseline as the first, indefinitely.
Diego’s campaign-attribution report, up close
The report on the left is what Copilot returned to Diego’s one-line prompt: a defensible-looking one-page executive summary of Q3 campaign-attributed pipeline with a takeaway sentence. On its face it passed casual review. Under the surface, Copilot silently picked a measure that answers a related question (attributed revenue, not attributed pipeline), picked individual-campaign grain (obscuring the campaign-type story leadership actually reads), and produced a narrative that named «the strongest two campaigns» by raw pipeline dollars (which favours longer-active campaigns). Three failure modes shipping invisibly. The report on the right is the CSAR-directed rebuild: six Crystallize questions surface all three; Scope accepts the corrected brief; Assemble produces the defensible one-page report; Refine catches three surface-level polish items; Diego reconciles against the finance close and ships.
- Cold Copilot picks a measure that answers a related question. The prompt asked for campaign-attributed pipeline; Copilot returned attributed revenue. Both measures exist in the semantic model; both are technically defensible on their own; only one is what Diego’s leadership team uses to compare campaigns. The detection move: the number does not tie to the marketing team’s existing dashboards.
- Grain drift silently produces the wrong shape of chart. Diego’s leadership discusses six campaign types; Copilot listed 47 individual campaigns. Individual-campaign grain is not wrong; it is wrong for the audience’s decision, and the report has to be rebuilt at campaign-type grain for the takeaway sentence to be meaningful.
- Smart Narrative can be technically true and operationally backward. «The two strongest campaigns» named in Copilot’s narrative were the two with the longest active windows in Q3 (16 weeks vs 8-week average). On a pipeline-per-active-week basis (the metric leadership actually uses) they were below average. Sara asks for pipeline-per-active-week to be added to the takeaway; the two «strongest» names change.
- Reconciliation is the ship gate, not a polish step. Before shipping, Diego opens the finance close report and confirms the year-to-date number on the KPI card matches to within rounding. This is the deciding evidence check — the Refine corrections are surface-level; the underlying measure, grain, and takeaway are defensible against the BRD.
Inspect the trace. The three cold failure modes, the six Crystallize questions with Diego’s answers, and the three Refine corrections are all available as a flat CSV. Download diego-campaign-attribution.csv · Dataset README and schema.
Try this activity — reconcile a Copilot report against source of truth
This activity walks the Diego reconciliation move against a Copilot-generated report. Total time: 30–45 minutes; requires Power BI + Copilot-ready capacity.
-
Generate the report. Against the CloudRevenue dataset, prompt Copilot: «Build a report for the CFO showing Q3 services revenue by product family, with the top-three narrative highlights.» Accept the first output. Save it to a working page.
-
Write the source-of-truth DAX for each visual. For each visual on the report, open a fresh page and reproduce the underlying measure directly in DAX — do not use Copilot for this. Example DAX for the primary revenue-by-product-family bar:
Q3 Services Revenue by Family = CALCULATE(SUM(Fact[NetRevenue]), Product[Segment] = "Services", DATESBETWEEN('Date'[Date], DATE(2026,7,1), DATE(2026,9,30))). Adjust field names to your dataset. Compare the DAX result to what the Copilot visual shows. Note any variance. -
Classify each variance by failure mode. For each variance you find, name which of the three Ch 9 failure modes it is: wrong-measure (different field), wrong-grain (different aggregation), or wrong-narrative (Smart Narrative claim not supported by the visual). Some variances may be the analyst’s DAX being wrong — that is also useful information.
-
Fix at the model layer if you can. For each wrong-measure or wrong-grain failure that traces to a model defect (ambiguous field name, overlapping measure, missing dimension), consider whether the fix belongs in the model rather than in a per-report Refine correction. Model-layer fixes compound; per-report fixes do not. Note which fixes would be model-level.
-
Assemble the defensibility bundle. For the shipped report, assemble: (1) the Crystallize prompt, (2) the Scope restatement, (3) the Assemble output snapshot, (4) the decisions-made and (5) decisions-deferred lists, and (6) the Refine corrections with the failure-mode classification from step 3 attached. This is the audit trail that lets the CFO’s eventual «where does this number come from?» get answered in minutes, not hours.
-
Reflect (three prompts). Write one sentence in response to each:
- Which failure mode showed up most in your reconciliation?
- How many of the surfaced variances were model-layer defects the model author could fix once, versus per-report defects the Refine step has to catch every time?
- How long did reconciliation take, and how long would the eventual «why does this number differ from the source system?» investigation have taken if the report had shipped without reconciliation?
The reflection is the activity’s payoff. Skipping it turns the exercise into paperwork.
Optional extension: repeat the activity against a semantic model your team owns and ships from. If the reconciliation surfaces more than one wrong-measure failure, the model itself is the fix target — not the report.
Related site resources
- CloudRevenue dataset: the dataset the activity above runs against; ships with a documented SCHEMA.md that names the deliberate imperfections you will find.
- Prompt Library: the CSAR prompts include a Report-Generation-specific Crystallize prompt that is worth reading before running the activity.
- Chapter 8 companion: the previous chapter — the CSAR loop this chapter applies to full-report generation.
- Chapter 10 companion: the next chapter — per-AI-visual verification moves; the wrong-narrative failure generalises there to the cross-surface confidently wrong narrative pattern.
- Chapter 11 companion: covers the Prep-for-AI investment that turns a semantic model Copilot-ready.
Cited in the book
Chapter 9’s bibliography lives in the book’s Appendix C (living version in errata). The chapter’s operative references:
- Microsoft Learn — Copilot in Power BI. Vendor documentation for the surface; nondeterminism documented here.
- Ferrari, A., & Russo, M. (2019). The Definitive Guide to DAX (2nd ed.). Microsoft Press. The DAX and semantic-model reference under the wrong-measure failure diagnosis.