Companion to Chapter 7 — the Hinge. Chapter 7 names the shift in decision rights when AI produces the first draft (the author-to-director contract), the reorganisation of analyst attention up the cognitive concern ladder (mechanics to argument), the movement of verification cost from tacit to explicit, and the readiness gate — a six-check self-audit (one per Part I chapter plus a defensibility capstone) that the reader passes before entering Part II. It also names the practical prerequisite Part II requires: a Copilot-ready capacity (paid Fabric F2+ or Premium P1+). This page carries what the book cannot: curated further reading beyond Appendix C on human-AI collaboration and role transitions, a five-question self-check quiz on the hinge concepts, and a hands-on activity that runs the six-check readiness gate against your own current practice.
Use the further reading to see the author-to-director shift under other names (Mollick’s co-intelligence, the human-in-the-loop literature). Use the quiz to check whether the four hinge concepts have moved into vocabulary. Use the activity to find out honestly whether you are ready for Part II or whether you should revisit a specific Part I chapter first.
Further reading
Books, articles, and papers beyond the book’s own bibliography (Appendix C, updated in errata) on the analyst-side experience of shifting from hand-builder to AI-director.
- Mollick, E. (2024). Co-Intelligence: Living and Working with AI. Portfolio. The most useful single volume on how a knowledge worker should organise their working relationship with generative AI without abdicating judgment. Mollick’s «jagged frontier» framing — that the model is superhuman at some tasks and dangerously wrong at adjacent ones — is the exact reason the readiness gate is not optional. Newsletter with weekly essays at oneusefulthing.org.
- Dell’Acqua, F., et al. (2023). «Navigating the Jagged Technological Frontier: Field Experimental Evidence of the Effects of AI on Knowledge Worker Productivity and Quality.» Harvard Business School Working Paper 24-013. The empirical study behind Mollick’s framing. Consultants using GPT-4 outperformed non-users on tasks inside the frontier by ~40% and underperformed on tasks outside it — the direct evidence for why the readiness gate’s «can I review the output?» question matters more than the «can I generate output?» question. Free PDF at hbs.edu/faculty/Pages/item.aspx?num=64700.
- Kahneman, D. (2011). Thinking, Fast and Slow. Farrar, Straus and Giroux. The System 1 / System 2 framing that underlies the «verification cost, tacit vs explicit» distinction. Hand-building embeds verification in System 1 (fast, unconscious, embedded in the act of building); AI-directed work moves it to System 2 (slow, deliberate, a scheduled review pass). Chapters 1–3 for the framing, Chapter 9 («Answering an Easier Question») for the failure mode Ch 7’s hinge is designed to prevent.
- Kozyrkov, C. — Decision Intelligence writing. Kozyrkov (former Google Chief Decision Scientist) has written extensively on the role transition from producer to reviewer — the exact shift Ch 7 names as the author-to-director contract. Her writing is short, opinionated, and operational. Medium at kozyrkov.medium.com.
- Anthropic — Prompt Engineering Guide. The vendor-neutral operational guide to structuring prompts for Claude and similar models. The «chain-of-thought» and «role-and-context» patterns are the technical scaffolding under the CSAR loop Ch 8 introduces. Free at docs.anthropic.com/en/docs/build-with-claude/prompt-engineering/overview. Microsoft’s equivalent for Copilot in Power BI lives in the vendor documentation catalogued in Resources.
Last curated: 2026-07-18. Reviewed quarterly. Suggestions welcome via the errata page.
Self-check quiz
Five questions on Ch 7’s hinge concepts. Answer them out loud before opening the reveal.
-
Q1. Chapter 7 introduces the «author-to-director contract» as the shift Part II depends on. State it explicitly: what changes about decision rights when AI produces the first draft?
Show answer
The analyst stops making every chart choice and starts briefing, critiquing, and deciding whether the draft ships. In hand-built work, the analyst is the author — every choice on screen is theirs. In AI-directed work, the analyst is the director — the AI makes the first-draft choices, the analyst names the specification (Crystallize), reviews the output against a rubric (Refine), and holds the ship-or-discard decision. The role changes; the ownership of the artifact does not. A director who accepts an undirected first cut is not directing.
-
Q2. Ch 7 organises analyst attention along the «cognitive concern ladder.» Name the rungs bottom-to-top and describe what AI direction lets the analyst offload.
Show answer
Physical → Signal → Data → Information → Knowledge/domain → Strategic. Physical is the mechanics of the artifact (typing, clicking, wiring). Signal is whether the encoding preserves the numbers. Data is the field set, grain, filtering. Information is whether a cold reader extracts the takeaway. Knowledge/domain is whether the takeaway matches what you know about the business. Strategic is whether this is the right chart to be building at all. AI absorbs the lower rungs (physical, signal, and much of data) — but only for analysts who built them by hand first, because reviewing what you offload is a rung-4-and-up activity that presupposes rung-1-through-3 fluency.
-
Q3. Ch 7 names «verification cost, tacit vs explicit» as a load-bearing concept. What is the distinction, and where does the verification cost go when the analyst moves from hand-built to AI-directed?
Show answer
Tacit verification cost is the cost that hand-building embedded silently in the act of building — the analyst notices the wrong axis mid-drag, the color choice fails a mental grayscale check while placing the swatch. Explicit verification cost is a scheduled review pass on the finished AI-generated output. The cost does not disappear when the analyst moves to AI-directed work — it moves above the line. Same total cost, different location. The analyst who treats AI as «free» because generation is fast has missed that verification moved, not vanished. Skipping it produces plausible-looking output (Ch 1).
-
Q4. Ch 7 gates Part II entry with a six-check readiness pass. What are the six checks, and what does failing one specifically imply?
Show answer
One check per Part I chapter: Ch 1 principles-first internalisation; Ch 2 BRD authoring; Ch 3 Big Idea and three-act arc; Ch 4 chart-family selection; Ch 5 focus and decluttering; Ch 6 color, type, and accessibility. Plus a defensibility capstone — can you review a Copilot-generated chart against all six? Failing a check sends the reader back to the corresponding Part I chapter, not forward to Part II. The book’s claim: returning to revisit a principle is cheaper than discovering, three chapters into Part II, that the rubric you were supposed to be applying to AI output was never internalised.
-
Q5. Ch 7 introduces the «Copilot-ready capacity» as a practical prerequisite for Part II. What does the term mean, and what specifically has to be true for Part II’s exercises to run?
Show answer
An administrative prerequisite: paid Fabric F2+ SKU or Power BI Premium P1+ SKU with Copilot enabled in the tenant. A Power BI Free workspace or a trial-capacity workspace cannot run Copilot. A trial workspace can consume Copilot if it is assigned to a paid Fabric Copilot capacity, but a trial capacity by itself cannot host the feature. Named as a check because it is better to find out on page 145 than mid-Chapter-9 when the reader is trying to reproduce a Copilot Report Generation walk-through and the button is grayed out.
Nadia’s Q3 revenue-by-region, up close
The chart on the left is what Copilot produced Wednesday morning from Nadia’s off-hand prompt: a sorted bar of Q3 revenue by region with a descriptive title, no plan reference, and no per-region variance callout. The chart on the right is the one Nadia has hand-built quarterly for two years and the one her CFO trusts. The quarter aggregate ($28.4M) lands exactly on plan on both charts — and only the right chart makes visible the NA -5.3% miss that is the actual story of the quarter.
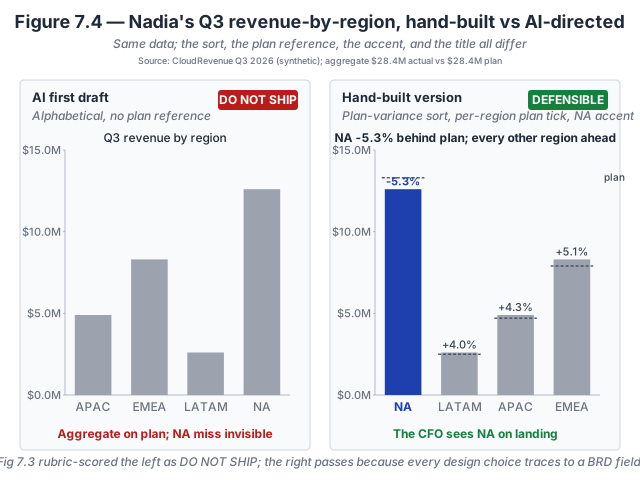
- Sort order carries the argument. Alphabetical (APAC, EMEA, LATAM, NA) is the default output shape. Sorting by plan-variance ascending puts the region that missed plan in the eye’s first landing zone — the position the CFO’s attention lands on first when the chart appears on screen.
- Plan reference is the load-bearing comparison. Without the per-region plan tick, the CFO reads the chart as «NA is our largest region» and moves on. With the plan tick, the CFO reads the chart as «NA is behind plan by 5.3% while every other region beat theirs» — a fundamentally different conclusion from the same numbers.
- Accent color is a decision, not a default. A single accent colour on the NA bar tells the CFO where to look; uniform brand colour tells the CFO to look everywhere and read carefully. The accent is the visual expression of the Big Idea in the title.
- The title asserts the claim. «NA -5.3% behind plan; every other region on or ahead» is the sentence the CFO would need to say in the meeting. The chart’s job is to make that sentence visually inspectable in five seconds. «Q3 revenue by region» is the sentence the raw table already told you; a chart that repeats it does no additional work.
Why the AI first draft is not defensible. The chart on the left scored red on Context (BRD asked plan-tracking; chart shows region comparison) and Story (viewer cannot summarize the argument in one sentence) on the five-principle rubric — the diagnosis Fig 7.3 walks through step by step. The rubric is what let Nadia name the defects out loud and hand-build the corrected chart in the same twenty minutes. The chart on the right passes the same rubric on all five checks.
Inspect the numbers. The four-region dataset with plan and actual for each region is available as a flat CSV so you can rebuild either chart in your own tool. Download nadia-q3-region.csv · Dataset README and schema.
Try this activity — run the six-check readiness gate on yourself
This activity is the one Ch 7 explicitly asks the reader to run before Part II. Total time: 30–45 minutes; can be done on paper.
-
Print or open the readiness rubric. Six checks, one per Part I chapter, plus a capstone. For each check, score yourself Pass / Partial / Fail against the specific question. Do not skim — the checks require you to recall the concept, not recognise it. If you can only recognise it when you re-open the chapter, that is a Partial at best.
- Ch 1 (principles-first internalisation): Can you name Cleveland–McGill’s accuracy hierarchy top to bottom without opening the chapter?
- Ch 2 (BRD authoring): Can you write a six-field BRD (audience, decision, question, comparison, time window, success criterion) for a real project you own, without a template in front of you?
- Ch 3 (Big Idea and three-act arc): Can you name the four constraints on a Big Idea (one sentence, specific, action-implying, backed by a number) and the three framings (comparison, change, distribution)?
- Ch 4 (chart-family selection): For each of the five families (Comparison, Composition, Distribution, Relationship, Trend), can you name the canonical chart and the default failure mode?
- Ch 5 (focus and decluttering): Can you describe the remove-until-it-breaks pass and the pre-attentive-attribute rule from memory?
- Ch 6 (color, type, accessibility): Can you name the three palette types, the color job each fits, and the CVD-simulation check?
-
Run the defensibility capstone. Take any chart Copilot generated for you in the last quarter (or generate one now with a naked prompt). Review it against all six Part I chapters. Can you explain to a colleague which principles the chart satisfies and which it violates? If yes, the capstone passes. If you would need to open the book to make the case, the capstone is Partial.
-
Check Copilot-ready capacity. Log into your Power BI tenant. Confirm you have a workspace assigned to a paid Fabric F2+ capacity, or a Power BI Premium P1+ workspace, with Copilot enabled. If not, the practical prerequisite is missing — Part II’s exercises will not run against your tenant. Options: request access from your admin, sign up for a Fabric 60-day trial (per the Getting Started page), or plan to read Part II without running the exercises live.
-
Score honestly. Total your Pass / Partial / Fail across seven checks (six chapters plus capstone). Interpretation guide (author’s take, not a bright line):
- 7 Pass: proceed to Ch 8.
- 5–6 Pass with 1–2 Partial: proceed, but keep the Partial chapter open as reference while working through Part II.
- Any Fail, or 3+ Partial: return to the specific Part I chapters that failed. Cheaper to reread now than to discover mid-Part-II that the rubric is not there.
-
Reflect (three prompts). Write one sentence in response to each:
- Which check was hardest, and does the difficulty match what you would have predicted before the exercise?
- Where is the biggest gap between what you thought you knew and what you can recall?
- What one Part I concept would most change how you review Copilot output tomorrow?
The readiness gate is not a test to pass under pressure; it is a diagnostic. Failing a check now saves a much larger cost later — a shipped Copilot artifact whose defects the analyst could not name.
Related site resources
- Getting Started: Power BI account setup, including the Fabric-trial path to Copilot-ready capacity if your tenant does not have one.
- Chapter 1, 2, 3, 4, 5, 6: the Part I chapter companion pages. Each has its own quiz and activity; the readiness gate is a compression of what those seven pages together practice.
- Chapter 8 companion: the next chapter — introduces the CSAR loop, the operational protocol Part II rests on.
- Prompt Library: the seven canonical CSAR prompts; if you passed the readiness gate, these are the operational surface you will use in Part II.
- Appendix E — BRD Field Guide: if the BRD check was where you scored Partial, the template plus completed exemplars are the fastest way to close the gap.
Cited in the book
Chapter 7’s bibliography lives in the book’s Appendix C (living version in errata). The chapter’s operative references:
- The Verification Habit (sister book). Chapter 9 introduces the cognitive concern ladder in its general form; Ch 7 applies it to visualization work.
- Kahneman, D. (2011). Thinking, Fast and Slow. Farrar, Straus and Giroux. The System 1 / System 2 framing underlying the tacit-vs-explicit verification-cost distinction.